The trajectory of the Moon's shadow takes it between the sunrise terminator and the South Pole. As viewed from the Sun's direction, the Moon's shadow passes around the "back" side of the pole between Earth's axis of rotation and the terminator. Consequently, the track of totality travels east to west rather the usual west to east direction. Furthermore, the 500 kilometer wide path both begins and ends at sunrise, just like the May 31 annular eclipse. The unusual characteristics of these two events is directly attributed to their grazing geometries in Earth's polar regions coupled with the close temporal proximity of the eclipses with summer solstice in each hemisphere.
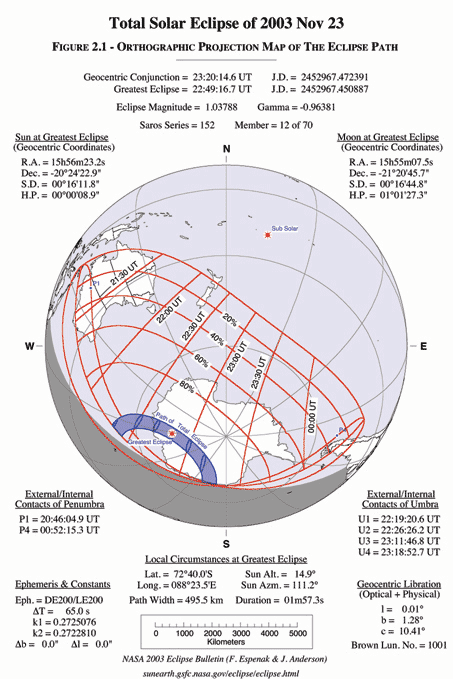
The instant of greatest eclipse occurs in Wilkes Land at 22:49:17 UT when the axis of the Moon's shadow passes closest to the center of Earth (gamma = -0.964). At this point, the duration of totality reaches its maximum of 1 minute 55 seconds with a Sun altitude of 15°. The duration and altitude slowly drop as the umbra's path curves from southwest to northwest. The umbra reaches the Antarctic coast in Queen Maud Land, which harbors several more research stations (Novolazarevskaya, Maitri). From Maitri, the 1 minute 19 second total phase occurs with the Sun just 2° above the horizon at 23:17 UT.
Two minutes later, the path ends and the shadow leaves Earth's surface (23:19 UT) one hour after it began. Over the course of its sixty minute trajectory, the Moon's umbra sweeps over a track approximately 5,000 kilometers long and covering 0.51% of Earth's surface area.
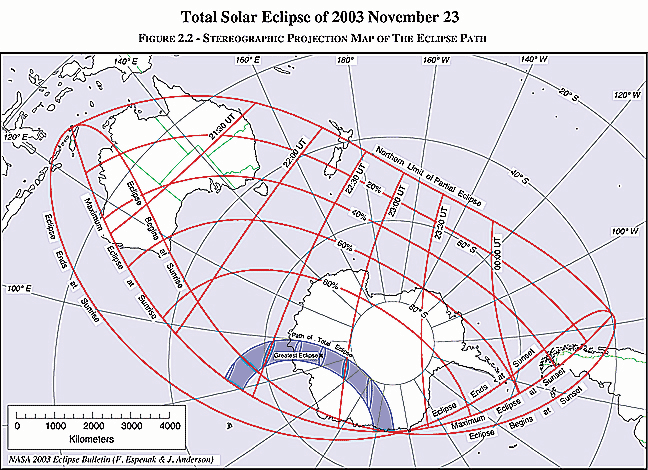
The rest of Antarctica will see a partial eclipse as well as most of New Zealand, Australia, southern Argentina and Chile (Figure 2.2). Outside of Antarctica, southwestern Australia will witness the largest eclipse. For instance, citizens of Perth will be treated to an early morning partial eclipse of magnitude 0.612. In contrast, the Cape York Peninsula in northeastern Australia lies beyond the penumbra's path and will miss the eclipse entirely.
The limits of the Moon's penumbral shadow define the region of visibility of the partial eclipse. This saddle shaped region often covers more than half of Earth's daylight hemisphere and consists of several distinct zones or limits. At the northern boundary lies the limit of the penumbra's path. Great loops at the western and eastern extremes of the penumbra's path identify the areas where the eclipse begins/ends at sunrise and sunset, respectively. Bisecting the 'eclipse begins/ends at sunrise and sunset' loops is the curve of maximum eclipse at sunrise (western loop) and sunset (eastern loop). The exterior tangency points P1 and P4 mark the coordinates where the penumbral shadow first contacts (partial eclipse begins) and last contacts (partial eclipse ends) Earth's surface. The path of the umbral shadow bisects the penumbral path from west to east and is shaded dark gray.
A curve of maximum eclipse is the locus of all points where the eclipse is at maximum at a given time. They are plotted at each half hour Universal Time (UT), and generally run in a north-south direction. The outline of the umbral shadow is plotted every ten minutes in UT. Curves of constant eclipse magnitude delineate the locus of all points where the magnitude at maximum eclipse is constant. These curves run exclusively between the curves of maximum eclipse at sunrise and sunset. Furthermore, they are quasi-parallel to the northern penumbral limit and the umbral path of total eclipse. The southern limit of the penumbra may be thought of as a curve of constant magnitude of 0%, while adjacent curves are for magnitudes of 20%, 40%, 60% and 80%. The northern and southern limits of the path of total eclipse are curves of constant magnitude of 100%.
At the top of Figure 2.1, the Universal Time of geocentric conjunction between the Moon and Sun is given followed by the instant of greatest eclipse. The eclipse magnitude is given for greatest eclipse. For central eclipses (both total and annular), it is equivalent to the geocentric ratio of diameters of the Moon and Sun. Gamma is the minimum distance of the Moon's shadow axis from Earth's center in units of equatorial Earth radii. The shadow axis passes south of Earth's geocenter for negative values of Gamma. Finally, the Saros series number of the eclipse is given along with its relative sequence in the series.
Figures 2.1 and 2.2 may be used to quickly determine the approximate time and magnitude of maximum eclipse at any location within the eclipse path.
Although no corrections have been made for center of figure or lunar limb profile, they have little or no effect at this scale. Altmospheric refraction has not been included because it depends on the atmospheric temperature-pressure profile, which cannot be predicted in advance. These maps are also available on the Web.
From the polynomial form of the Besselian elements, any element can be evaluated for any time t1 (in decimal hours) via the equation:
t = t1 - t0 (decimal hours) and
t0 = 23.000 TDT.
The polynomial Besselian elements were derived from a least-squares fit to elements rigorously calculated at five separate times over a six hour period centered at t0. Thus, the equation and elements are valid over the period November 23 20.00 < t1 � November 24 02.00 TDT.
Table 2.2 lists all external and internal contacts of penumbral and umbral shadows with Earth. They include TDT times and geodetic coordinates with and without corrections for ΔT. The contacts are defined as:
P1 Instant of first external tangency of penumbral shadow cone with Earth's limb (partial eclipse begins)
P4 Instant of last external tangency of penumbral shadow cone with Earth's limb (partial eclipse ends)
U1 Instant of first external tangency of umbral shadow cone with Earth's limb (umbral eclipse begins)
U2 Instant of first internal tangency of umbral shadow cone with Earth's limb
U3 Instant of last internal tangency of umbral shadow cone with Earth's limb
U4 Instant of last external tangency of umbral shadow cone with Earth's limb (umbral eclipse ends)
Similarly, the northern and southern extremes of the penumbral and umbral paths, and extreme limits of the umbra's central line are given. The IAU (International Astronomical Union) longitude convention is used throughout this publication (i.e., for longitude, east is positive and west is negative; for latitude, north is positive and south is negative). The path of the umbral shadow is delineated at two minute intervals in Universal Time in Table 2.3. Coordinates of the northern limit, the southern limit and the central line are listed to the nearest tenth of an arc-minute (~185 m at the Equator). The Sun's altitude, path width and umbral duration are calculated for the central line position. Table 2.4 presents a physical ephemeris for the umbral shadow at two minute intervals in UT. The central line coordinates are followed by the topocentric ratio of the apparent diameters of the Moon and Sun, the eclipse obscuration , and the Sun's altitude and azimuth at that instant. The central path width, the umbral shadow's major and minor axes and its instantaneous velocity with respect to Earth's surface are included. Finally, the central line duration of the umbral phase is given. Local circumstances for each central line position listed in Tables 2.3 and 2.4 are presented in Table 2.5. The first three columns give the Universal Time of maximum eclipse, the central line duration of totality and the altitude of the Sun at that instant. The following columns list each of the four eclipse contact times followed by their related contact position angles and the corresponding altitude of the Sun. The four contacts identify significant stages in the progress of the eclipse. They are defined as follows:
First Contact - Instant of first external tangency between the Moon and Sun (partial eclipse begins)
Second Contact - Instant of first internal tangency between the Moon and Sun (central or umbral eclipse begins; total or annular eclipse begins)
Third Contact - Instant of last internal tangency between the Moon and Sun (central or umbral eclipse ends; total or annular eclipse ends)
Fourth Contact - Instant of last external tangency between the Moon and Sun (partial eclipse ends)
The position angles P and V identify the point along the Sun's disk where each contact occurs . Second and third contact altitudes are omitted since they are always within 1° of the altitude at maximum eclipse.
Two additional columns are included if the location lies within the path of the Moon's umbral shadow. The umbral depth is a relative measure of a location's position with respect to the central line and path limits. It is a unitless parameter which is defined as:
The umbral depth for a location varies from 0.0 to 1.0. A position at the path limits corresponds to a value of 0.0 while a position on the central line has a value of 1.0. The parameter can be used to quickly determine the corresponding central line duration. Thus, it is a useful tool for evaluating the trade-off in duration of a location's position relative to the central line. Using the location's duration and umbral depth, the central line duration is calculated as: D = d / (1 - (1 - u)2)1/2 seconds [2.2] where:
u| = | umbral depth
| x | = | perpendicular distance from the shadow
axis (km)
| R | = | radius of the umbral shadow as it
intersects Earth's surface (km)
| |
The final column gives the duration of totality. The effects of refraction have not been included in these calculations, nor have there been any corrections for center of figure or the lunar limb profile.
The geographic coordinates of cities are from The New International Atlas (Rand McNally, 1991). Coordinates in Antarctica are from this source. The city names and spellings presented here are for location purposes only and are not meant to be authoritative. They do not imply recognition of status of any location by the United States Government.
The Watts charts have been digitized and may be used to generate limb profiles for any libration. Ellipticity and libration corrections can be applied to refer the profile to the Moon's center of mass. Such a profile can then be used to correct eclipse predictions which have been generated using a mean lunar limb. The lunar limb profile in Figure 2.5 includes corrections for center of mass and ellipticity [Morrison and Appleby, 1981]. It is generated for the central line at 22:40 UT which is close to Russia's Mirny research base. The Moon's topocentric libration (physical + optical) is l=+0.21°, b=+0.29°, and the topocentric semi-diameters of the Sun and Moon are 971.8 and 1008.4 arc seconds, respectively. The Moon's angular velocity with respect to the Sun is 0.632 arc seconds per second.
The radial scale of the limb profile (bottom of Figure 2.5) is greatly exaggerated so that the true limb's departure from the mean lunar limb is readily apparent. The mean limb with respect to the center of figure of Watts' original data is shown (dashed) along with the mean limb with respect to the center of mass (solid). Note that all the predictions presented in this publication are calculated with respect to the latter limb unless otherwise noted. Position angles of various lunar features can be read using the protractor marks along the Moon's mean limb (center of mass). The position angles of second and third contact are clearly marked along with the north pole of the Moon's axis of rotation and the observer's zenith at mid-totality. The dashed line with arrows at either end identifies the contact points on the limb corresponding to the northern and southern limits of the path. To the upper left of the profile are the Sun's topocentric coordinates at maximum eclipse. They include the right ascension R.A., declination Dec., semi-diameter S.D. and horizontal parallax H.P. The corresponding topocentric coordinates for the Moon are to the upper right. Below and left of the profile are the geographic coordinates of the center line at 22:40 UT while the times of the four eclipse contacts at that location appear to the lower right. Directly below the profile are the local circumstances at maximum eclipse. They include the Sun's altitude and azimuth, the path width, and central duration. The position angle of the path's northern/southern limit axis is PA(N.Limit) and the angular velocity of the Moon with respect to the Sun is A.Vel.(M:S). At the bottom left are a number of parameters used in the predictions, and the topocentric lunar librations appear at the lower right.
In investigations where accurate contact times are needed, the lunar limb profile can be used to correct the nominal or mean limb predictions. For any given position angle, there will be a high mountain (annular eclipses) or a low valley (total eclipses) in the vicinity that ultimately determines the true instant of contact. The difference, in time, between the Sun's position when tangent to the contact point on the mean limb and tangent to the highest mountain (annular) or lowest valley (total) at actual contact is the desired correction to the predicted contact time. On the exaggerated radial scale of Figure 2.4, the Sun's limb can be represented as an epicyclic curve that is tangent to the mean lunar limb at the point of contact. Using the digitized Watts' datum, an analytical solution is straightforward and robust. Curves of corrections to the times of second and third contact for most position angles have been computer generated and plotted. The circular protractor scale at the center represents the nominal contact time using a mean lunar limb. The departure of the contact correction curves from this scale graphically illustrates the time correction to the mean predictions for any position angle as a result of the Moon's true limb profile. Time corrections external to the circular scale are added to the mean contact time; time corrections internal to the protractor are subtracted from the mean contact time. The magnitude of the time correction at a given position angle is measured using any of the four radial scales plotted at each cardinal point.
For example, Table 2.6 gives the following data for the Antarctic base Mirny:
Second Contact = 22:37:37.0 UT P2=117°
Third Contact = 22:39:30.7 UT P3=283°
Using Figure 2.5, the measured time corrections and the resulting contact times are:
C2=+0.5 seconds; Second Contact = 22:37:37.0 +0.5s = 22:37:37.5 UT
C3=-4.3 seconds; Third Contact = 22:39:30.7 -4.3s = 22:39:26.4 UT
The above corrected values are within 0.1 seconds of a rigorous calculation using the true limb profile.
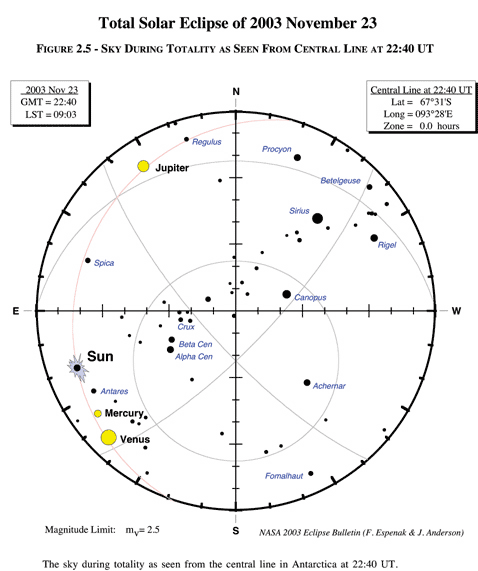
During the total solar eclipse of 2003, the Sun is in northern Scorpius near the border with Libra. From Antarctica, three naked eye planets and a number of bright stars will be above the horizon within the umbral path. Figure 2.5 depicts the appearance of the sky during totality as seen from the central line at 22:40 UT. This is close to Russia's Mirny research base, where the early morning eclipse occurs low in the southeastern sky.
The most conspicuous planet visible during totality will be Venus (mv=-3.8) located 25° east of the Sun in Ophiuchus. Mercury (mv=-0.4) lies between the Sun and Venus at a solar elongation of 16° east. Jupiter (mv=-1.8) is over a magnitude brighter than Mercury but it will be located in Leo in the northeastern sky 75° away from the Sun. From the central line at 22:40 UT, Venus, Mercury and Jupiter will have altitudes above the horizon of 9.4°, 12.6° and 12.7°, respectively. For comparison, the Sun's altitude will be 14°. Saturn and Mars are both be below the horizon.
A number of the bright stars may also be visible it the twilight sky during the total eclipse. Antares (mv=+1.06) is 10° southeast of the Sun. The great southern stars Alpha (mv=+0.14) and Beta (mv=+0.58) Centauri are high in the sky about 44° from the Sun. Canopus is near the zenith about 100° away and Achernar (mv=+0.45) stands high in the southwest. Sirius (mv=-1.44) and the bright stars of Orion lie in the northwest quadrant of the sky. It should be noted that star visibility requires a very dark and cloud free sky during totality.
The following ephemeris [using Bretagnon and Simon, 1986] gives the positions of the naked eye planets during the eclipse. Delta is the distance of the planet from Earth (A.U.'s), App. Mag. is the apparent visual magnitude of the planet, and Solar Elong gives the elongation or angle between the Sun and planet.
Weather stations are isolated and mostly confined to the shores. Inland, automatic stations measure a small selection of the possible variables: wind, temperature, pressure but not cloud cover, humidity, visibility or precipitation. It doesn't matter much - in the cold air absolute humidities are always low and precipitation is sparse. Data are often missing and frequently suspect. The length of the climatological record is short so that the statistics represent more �what is possible or typical� rather than give a serious account of the average conditions.
On the coast and at a very few inland locations, humans supplement the machine measurements, and the full suite of observations is available. For the eclipse observer, cloud cover is usually paramount, but in the extremes of the White Continent, temperature, wind and wind chill demand the attention of eclipse planners far more than in any other location in the world. While Mongolia and Siberia offered the possibility of extreme cold in the 1997 eclipse, Antarctica in 2003 virtually guarantees it.
The eclipse track is not forgiving, and there are only four venues from which it can be realistically observed. Two of these are at coastal locations, one near the Russian base at Mirny and the other near the western limit of the eclipse where a collection of German, Indian, Japanese and Russian bases congregate. The third site is �inland�, at whatever point adventure and finances can take an eclipse expedition. The fourth possibility is aboard an icebreaker at sea or near the coast along the sunrise portion of the path.
As the cold outflow moves over the relatively warm waters surrounding the continent, the air is rapidly saturated with moisture. Clouds form quickly bringing snow showers to the coastal regions and offshore ice fields. The wind shear along the edges of the cold air outbreaks and the strong temperature contrast between air and water helps to create a continuous supply of small scale lows along the coast.
Farther offshore, the southeast winds flowing off of the continent gradually abate and the westerly global flow asserts itself. This change in wind direction creates a zone of intense low-pressure development. The lows that form tend to travel east and southward, gradually moving toward the Antarctic coast where they weaken and die. Some stronger lows can penetrate into the continent, but these are rare, though the lack of observation and measurement makes the exact frequency of such systems uncertain. Even though the low itself may be confined to coastal waters, the higher clouds from such systems can penetrate well inland.
Lows moving along the coast tend to bring onshore winds as they approach and offshore southerlies as they depart. The first pushes moist air against the land and brings extensive stratiform cloudiness and continuous precipitation - either rain or snow - while the latter reinforces the normal cold outflow with its sunny skies from the continent margins.
The interior of the continent offers a considerably more relaxed climatology, notwithstanding the low temperatures. Water vapor is in short supply and weather systems from the north have difficulty scaling the steep slopes of the coast. Unfortunately observations of cloud cover are almost non-existent in central Antarctica, and satellite observations are limited by the lack of contrast between the icy surface and the clouds and the long polar nights. The Russian base at Vostok is the only one in the vicinity of the eclipse track that can provide cloud data but their statistics are probably representative of the conditions over much of the mid-continent portion of the track.
Temperatures along the coast are relatively warm and have the potential to rise above zero, but those inland are much lower. The coldest temperatures are a result of the long Antarctic nights, low humidity, high albedo, low cloud cover and high altitude of the interior that allows the surface to radiate energy into space with little interruption. The warmest temperatures that are found in the interior -18° C at Vostok) are a result of advection from coastal regions. On the eclipse track the coldest temperatures tend to be found near the Australian automatic weather stations LGB20 and LGB35. Fortunately such temperatures come with much better prospects for clear skies. Since warm temperatures on the coast are associated with cloudy weather, falling temperatures will be preferred on eclipse day as these bring in the drier air from the interior.
Though winds inland are about half the strength of those on the coast, the lower temperatures in the interior dominate the calculation of wind chill to bring values which can reach into the minus sixties. Frostbite can occur in less than four minutes in such weather. While the actual temperatures are considerably warmer, observers will probably want to limit their outdoor exposure while waiting for the lunar shadow, or at least make sure they have some shelter from the wind.
Mirny's weather is governed by strong downslope winds and a high frequency of offshore low pressure systems. While the blizzard season is receding in November, winds at eclipse time average a brisk 41 km/h (Table 2.11) with the highest reported value in the past 15 years reaching over 110 km/h. Temperatures are modest by Antarctic standards, with an average of -7°C and a range from minus 20 to the freezing point at eclipse time. The high winds bring a significant wind chill to the station however, and eclipse observers will have to dress accordingly. By Canadian and north European winter standards, the average eclipse-day conditions at Mirny appear to be relatively tolerable though the wind speeds are higher than is typical of the Earth's northern hemisphere.
Cloud cover at Mirny averages 6.4 tenths, a large value when compared with opportunities at past eclipses but comparable to the other coastal stations on and near the track. The distribution of cloudiness is a typical U-shape (Figure 2.5), with a high frequencies of low and high cloudiness and smaller frequencies of intervening values. If we make the assumption that the probability of seeing the eclipse is proportional to the frequency of the various levels of cloud cover, then Mirny offers a 36% chance of a successful expedition. This is slightly optimistic as no account has been taken of the low 13° altitude of the Sun.
Low-pressure disturbances moving toward the station can bring heavy clouds and precipitation for several days in a row but November is approaching the driest months of the year and these are relatively uncommon. Eclipse observers will be looking for southerly katabatic winds blowing from the high plateau, for such winds bring dry cold air and clear skies. Such winds are more frequent in the evening and overnight, which favors the sunset portion of the eclipse track rather than the morning portion at Mirny. The wind speed is critical however, for even under clear skies, blizzard conditions can develop if winds are too strong - anything above 35 km/h brings poor visibility and blowing snow. Heavy snow is rare during the summer months from November to February. Fog and ice crystal haze are rare at any time.
2.09 Sky During Totality
The total phase of an eclipse is accompanied by the onset of a rapidly darkening sky whose appearance resembles evening twilight about half an hour after sunset. The effect presents an excellent opportunity to view planets and bright stars in the daytime sky. Aside from the sheer novelty of it, such observations are useful in gauging the apparent sky brightness and transparency during totality.
Equinox = Mean Date
Object RA Dec Delta V Apparent
Diameter (")
Phase Solar
Elong (°)
Sun 15h56m25s 20°24'28" "
0.98745 -26.7 1943.7
Moon 15h55m35s -21°22'40
0.00239 15.4 2009.3
0.00 1.0W
Mercury 17h04m34s -25°03'35"
1.28941 -0.4 5.2
0.89 16.4E
Venus 17h43m08s -24°32'35"
1.49229 -3.8 11.2
0.91 25.0E
Mars 23h16m20s -05°57'46"
0.79238 -0.6 11.8
0.87 106.4E
Jupiter 11h11m23s +06°20'50"
5.56825 -1.8 35.4
0.99 74.9W
Saturn 06h53m56s +22°08'25"
8.26635 +0.1 20.1
1.00 138.8W
2.10 Introduction to Weather Prospects for November 23
This will probably be the first eclipse to be systematically observed from Antarctica - the coldest, windiest, highest and driest place on the Earth. The meteorology is simple because it is dominated by one factor: cold. Cold air forms in the center of the Antarctic Plateau, close to the south pole, and flows outward to the margins of the continent. The flow is primarily katabatic, driven by gravity as the heavy frigid air moves downhill toward the sea. Where the terrain funnels and confines this steady flow, wind speeds reach exceptional values, among the strongest ever recorded.
2.11 Weather Patterns
Antarctic winds flow outward from a cold high pressure system overlying the continent, turning gradually toward the west as they approach the coast. Descending from the 3000 meter mid-continent plateau, the air is dried even farther, bringing bright sunny skies to the continental margins. In some regions the winds are exceptionally strong - over 100 km/h - as the local topography squeezes and redirects them. Blizzards and blowing snow are common in such circumstances.
2.12 Coast of Queen Mary Land - Mirny
Mirny is the main Russian base in the Antarctic, situated on the coast of Queen Mary Land on a small peninsula that juts northward into the Davis Sea. Established in 1956, the station has the distinction of being best placed within the eclipse track, for the central line lies only a few tens of kilometers to the east. The station buildings, a collection of two-story rectangular blocks topped by various instrument domes, lies on four rocky outcrops about 20 meters above sea level. South of the station, the land rises to a height of 1500 meters within 100 km. A few small rocky islands lie offshore, but land-fast ice is observable much of the year. The 24-hour polar day begins on December 10 at Mirny, and so eclipse day will be one with long daylight and a short twilight.
2.13 Interior of Antarctica
While human observations are in limited supply, several automatic weather stations lie within the track of the eclipse and can provide temperature and wind information. These stations, LGB20, LGB35 and LGB59 (Table 2.11) show a considerably colder climate than the coastal regions. Though winds are frequently lighter on the interior plateau, wind chill values are colder because of the lower initial temperature. Observing from distant inland sites along the eclipse track will require special care for equipment and people.
The interior stations have a short period of record - from 4 to 10 years - and the climatology of the interior is only poorly revealed. For the three Australian automatic stations, average temperatures at eclipse time ranged from -28°C to -33°C. Extreme temperatures dropped as low as -41.5°C at LGB20. Wind chill values are 15 to 20 degrees colder on average, reaching below -60°C at LGB20. At LGB20 and LGB35, wind speeds are relatively low, about half of those at LGB59. The explanation likely lies in the configuration of the surrounding terrain. The prevailing wind direction at LGB59 is also at odds with most of the other interior stations, being northerly rather than the more typical southerly outflow.
For cloud cover statistics we are forced to rely on the data collected at Vostok, which lies considerably farther inland and at a higher altitude. Here we see a complete reversal of the cloud patterns of the coast, with clear skies being the most frequent report. The mean cloudiness of 3.4 tenths is nearly half that of Mirny, and the probability of seeing the eclipse rises to 66%. While inland sites on the track are probably not quite this favorable, the implications cannot be ignored - for this eclipse, inland areas are most likely to see the event by a considerable margin.
The impact of frontal cloudiness and weather systems is muted by distance from the oceans and the high altitude of the interior. Most of the clouds are at mid and high levels where, being composed entirely of ice crystals, they are frequently semi-transparent. This implies that the probability of seeing the eclipse is greater than the formal calculation (66%) would suggest.
The atmospheric transparency of inland Antarctica is legendary. The air is unpolluted except for occasional water vapor and ice crystals. Snowstorms are rare and tend to be at a minimum in the spring. During calm and clear weather, ice crystals are frequent, bringing a hazy sky and occasional ice fog. Both of these phenomena are more likely in winter than summer but their main effect on the eclipse will be to produce a halo around the sun. Drifting snow is common, occurring on nearly one third of the days at Vostok.
Temperature, wind chill and wind statistics for the sunset stations are similar to those at Mirny but cloud statistics are more variable. Neumayer is one of the grayest locations on the track with an average cloudiness of 7.6 tenths. Novolazarevskaja averages 5.7 tenths and Maitri only 3.9 tenths, a rather discordant amount given their proximity to the others. The reason for the much lower cloud cover at Maitri may be due to local conditions that favor downslope winds or to the short period of record that just happens to lie in a relatively sunny time. A comparison of hourly reports from Maitri with those at Novolazarevskaja shows a few large differences but a near-zero bias, so the second explanation would seem to be the most reasonable. The cloud climatology of the Russian base with its longer period of record seems to be more reliable for planning purposes.
With this in mind, cloudiness patterns along the eclipse sunset coast are similar to those at Mirny (Figure 2.5). Most of the cloud is at mid and high levels, a factor that does not augur well for such a low altitude eclipse. The formal probability of seeing the eclipse is calculated to be between 27 and 52 percent, with the 44% at Novolazarevskaja being the most representative figure. These must be regarded as too large in view of the very low angle toward the eclipse.
In interior regions, site selection will be more versatile, as almost all access will be by plane. Flat vistas where the winds are lightest should be easy to locate - a high spot might even be best, as winds will tend to flow downhill and away. Satellite imagery (most big bases have it) can be used to predict cloud motion and help select a site with a high prospect of clear skies.
The interior offers the best chances and the biggest challenges. Prospects for clear skies are twice those of the coast, depending on the distance and altitude at the site. Coastal regions offer more comfort and easier access, but at the expense of a high cloud frequency. Mirny seems to be the best lowland site, in large part because of the higher Sun. Observers there should attempt to move as far inland as possible to take advantage of the better weather away from the coast.