
|
Documentation > SXT Observation Notes > this page |
Image name: sxt_signal_at_sunset.png (click image to enlarge)
Image size: 12.9050 KB (1000x700)
Date submitted: 14-Dec-1994
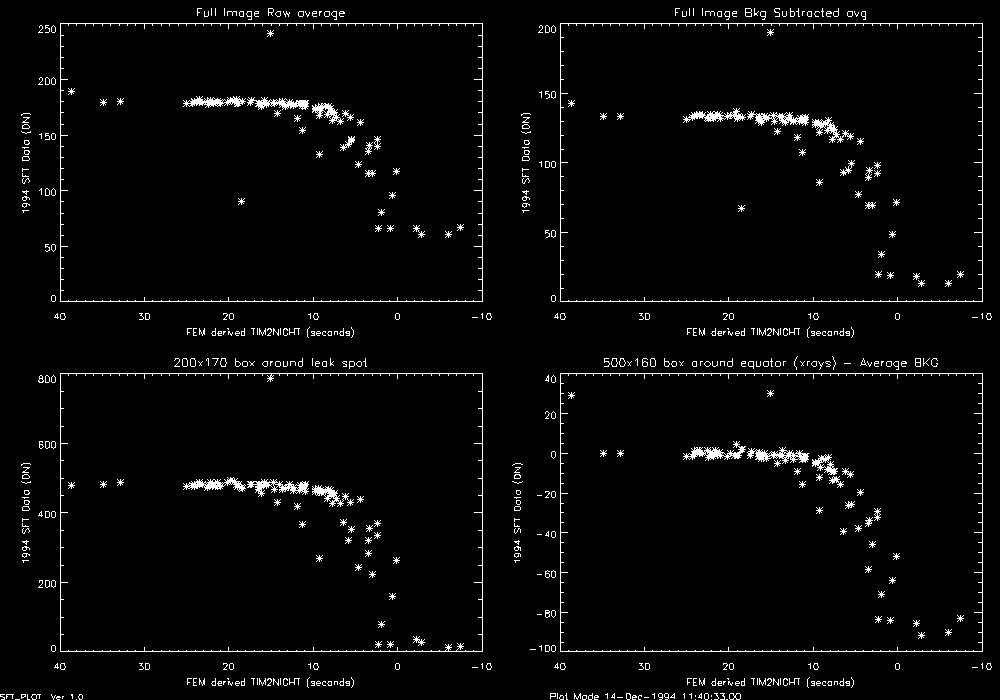
The following plots show the signal as detected by SXT as sunset
approaches.  The X axis is the time to night as derived from FEM
(TIM2ORBIT routine).  The plateau is where there are no x-rays
and simply the visible light leak.  The earth begins to occult
the sun at around 8 seconds before night, and this data shows
that the night prediction from the FEM files agrees identically
with when the SXT instrument sees night.  Good terminator images
are available for TIM2FMS between 8 and 20 seconds.

The images used were:
	* SFT 1994 images
	* DPE = 25
	* Half resolution
	* Nominal pointing
	* Thin Al filter

* The upper left plot is full image averages (after SXT_DECOMP)
* The upper right plot is full image averages after DARK_SUB
* The lower left plot is for a smaller box centered on the bright
  spot of the leak in the lower left corner of the image
* The lower right plot was trying to show the xray signal.  It
  was the average signal for a band around the equator, but the
  scatter/leak light dominates the signal.  The background was
  calculated  by taking the average of 15 SFT images and removing
  this scatter pattern.

  The leak/scatter dominates because of the quiet sun conditions
  and because so many pixels are contaminated by the leak/scatter.
  Visual inspection of a few images show that the x-ray features
  disapear at around 25 seconds before night.
