
|
Documentation > SXT Observation Notes > this page |
Image name: sfd_temp_comparison2.png (click image to enlarge)
Image size: 87.3070 KB (900x400)
Date submitted: 26-Jun-1996
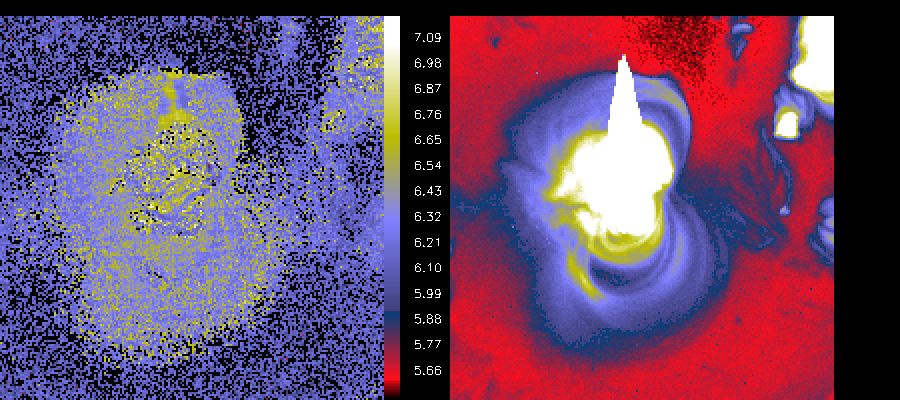
Temperature map(left) from MK_SFD with the compression algorithm
disabled, for the same image quartet used in the comparison between
the compressed SFD version and the raw data (via SXT_PREP). Again
one can see the residue of the saturation spike, but again one
can see the apparently better temperature structure S of the active
region.

HH 26-Jun-96
