
|
Documentation > SXT Observation Notes > this page |
Image name: sfd_temp_comparison.png (click image to enlarge)
Image size: 61.4250 KB (900x400)
Date submitted: 26-Jun-1996
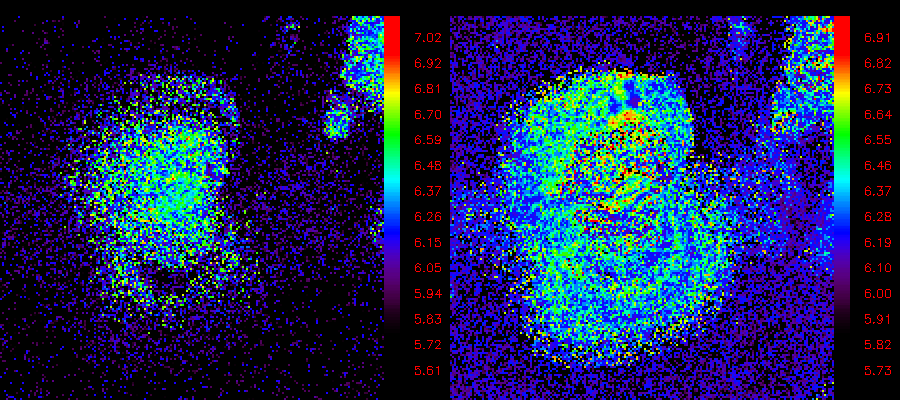
This is a comparison of temperatures obtained by using
SFD images (right) with SXT_COMPOSITE images at the same
times (left). This example is from Wang Jingxiu's AR and
the image times are

   0 10-FEB-93  03:17:21  QT/H  Open /Al.1  Half Norm C  23  2668.0  512x512
   1 10-FEB-93  03:19:29  QT/H  Open /AlMg  Half Norm C  25  5338.0  512x512
   2 10-FEB-93  03:21:37  QT/H  Open /AlMg  Half Norm C  15   168.0  512x512
   3 10-FEB-93  03:23:45  QT/H  Open /Al.1  Half Norm C  13    78.0  512x512

As we look at these, we note a couple of things. In the
SFD temperature map, there seems to be some residue of saturation
from the core of the AR (ie, to the N of the core). On the other
hand, the large loops to the S "look" real in the SFD map,
whereas the SFR temperatures do not show much that is significant.
Which do we trust?

HH, WJX 26-jun-96
