
|
Documentation > SXT Observation Notes > this page |
Image name: may92_region.png (click image to enlarge)
Image size: 142.839 KB (976x976)
Date submitted: 11-Apr-1995
TEMPERATURE ANALYSIS OF DIFFUSE CORONA
The data, prepared with SXT_PREP:
IDL> print,get_info(iout(ii))
0 8-MAY-92 03:24:02 QT/H Open /AlMg Half Norm C 28 15108.0 512x512
1 8-MAY-92 03:26:10 QT/H Open /Al.1 Half Norm C 28 15108.0 512x512
2 8-MAY-92 06:45:56 QT/H Open /AlMg Half Norm C 28 15108.0 512x512
3 8-MAY-92 06:48:02 QT/H Open /Al.1 Half Norm C 28 15108.0 512x512
4 9-MAY-92 16:15:56 QT/H Open /AlMg Half Norm C 28 15108.0 512x512
5 9-MAY-92 16:13:48 QT/H Open /Al.1 Half Norm C 28 15108.0 512x512
The results:
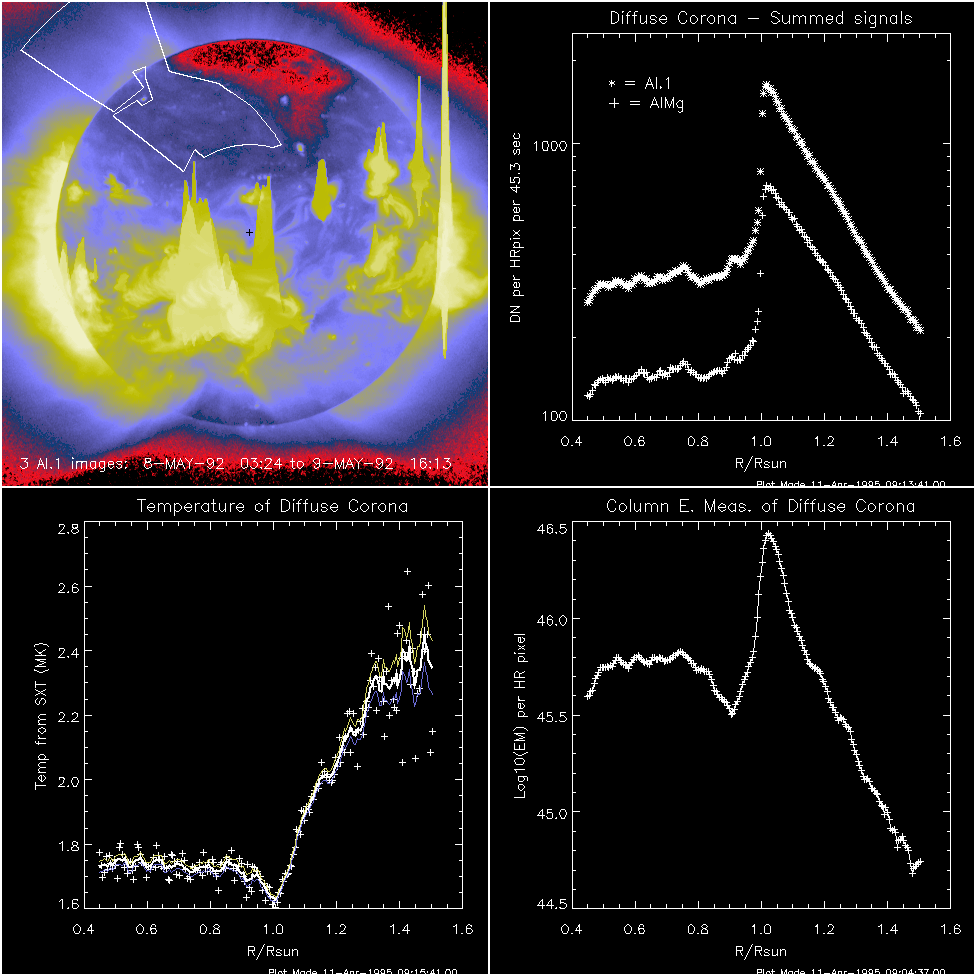
UL) Region chosen for Diffuse Corona Analysis
The picture is a sum of the following 3 images
0 8-MAY-92 03:26:10 QT/H Open /Al.1 Half Norm C 28 15108.0 512x512
1 8-MAY-92 06:48:02 QT/H Open /Al.1 Half Norm C 28 15108.0 512x512
2 9-MAY-92 16:13:48 QT/H Open /Al.1 Half Norm C 28 15108.0 512x512
and the region used for the temperature analysis is indicated by the
boundary in the NE and on the disk. This is a region spanning the boundary
between 2 weak "unipolar" regions.
UR) SXT signals for the sum of 3 15 sec exposures, averaged over annuli as
a function of distance from sun center. Half-resolution (4.91") pixels.
LL) Temperatures
The plot shows:
a. The individual temperatures as + symbols.
b. The 6-point smoothed temperatures as the thick white line.
c. The 1 sigma errors on the smoothed temperatures as the colored
lines.
LR) Emission Measure for the individual temperatures, 6-point smoothed.
L. Acton
11-April-1995
