
|
Documentation > SXT Observation Notes > this page |
Image name: Time_of_the_fourth_entrance_filter_anomaly.png (click image to enlarge)
Image size: 5.50300 KB (512x512)
Date submitted: 05-Feb-1998
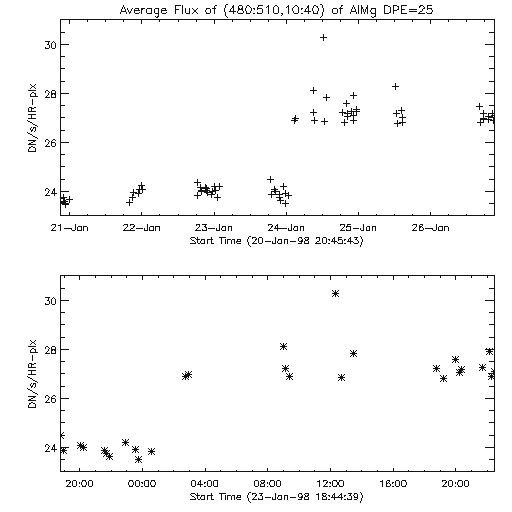
		Time of the fourth entrance filter failure

I have taken the same approach as Loren to narrow down the time of the
fourth entrance filter failure.  That is, to get the flux of a small box
located at bottom right of AlMg images with exposure DPE=25 (5.3 s).  This
is because the cadence of these images is higher than that of images in
the narrowband filter that are taken to monitor the level of straylight.
Like Loren's analysis for the time of the first entrance filter failure,
decompression of the images is the only image processing.  I have done
special reformatting for DSN data to get better time coverage.

The conclusion here is that straylight increased some time between
00:33 and 02:44 UT on 24-Jan-98.  In comparison, Hugh's earlier estimate
was between 16:35 and 23:15 UT on 23-Jan-98 on the basis of the narrowband
images.  But his times seem to be affected by poor sampling of these
images.  The plots presented here show that the signal level increased by
about 10 % between 00:33 and 02:44 UT on 24-Jan-98.  It is unclear how much
of this represents the increase of straylighy.  It is not possible to get
the time more accurately, because there were no data in between.


Nariaki Nitta, 5-Feb-98, at ISAS to be one-week SXT_CO
