
|
Documentation > SXT Observation Notes > this page |
Image name: SXT_T_Sensitivity.png (click image to enlarge)
Image size: 6.84800 KB (512x512)
Date submitted: 24-Jul-1995
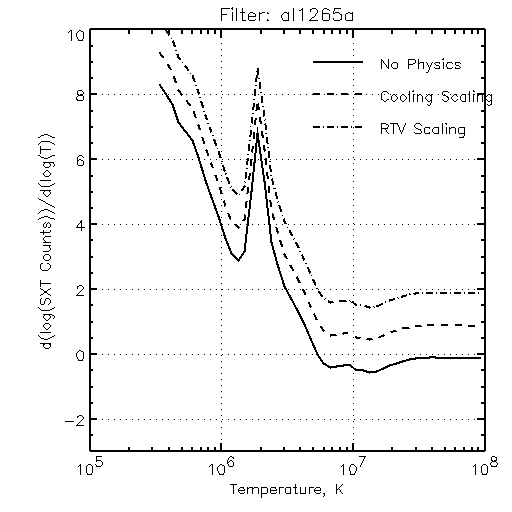
How does the SXT image brightness vary as a loop cools? This plot shows
the log derivative of SXT signal vs temperature for thin Al. In the
domain where d(logS)/d(logT) is about 1, the brightness scales
approximately with the temperature. At lower temperatures it varies as
a higher power. I suppose that the bump at 2 MK is due to a dominant
spectral line in the MEWE_SPEC data base.  The "cooling scaling" entry
refers to the approximate relationship found by Jakimiec et al. (A and
Ap 253, 269), namely that n varies as T. The RTV scaling would be n
proportional to T^2 for a fixed volume. "No physics" just gives back
the temperature dependence in MEWE_SPEC. The rapid increase of the log
derivative for low temperatures reminds us that we can't see the
footpoints very well with SXT.
     The program LOG_DERIV will show these curves for any of the
analysis filters.
     If a flare loop cools continuously by radiation only, dT/dt is
almost a constant, and according to the dashed line the SXT signal
should decrease proportionally. At lower temperatures the SXT loop
should rapidly disappear as the cooling continues, unless of course
additional heat goes into it. The "RTV Scaling" plot here is kind of
bogus, because it assumes equilibrium and no time variations anyway. If
you want to see something really bogus, use /all in the call to
LOG_DERIV and admire what adiabatic scaling will do!

HSH 21 July 1995
HSH 24 July 1995 (rev 1.1)
