
|
Documentation > SXT Observation Notes > this page |
Image name: SFC_and_New_Separation.png (click image to enlarge)
Image size: 26.6610 KB (768x768)
Date submitted: 20-Feb-1998
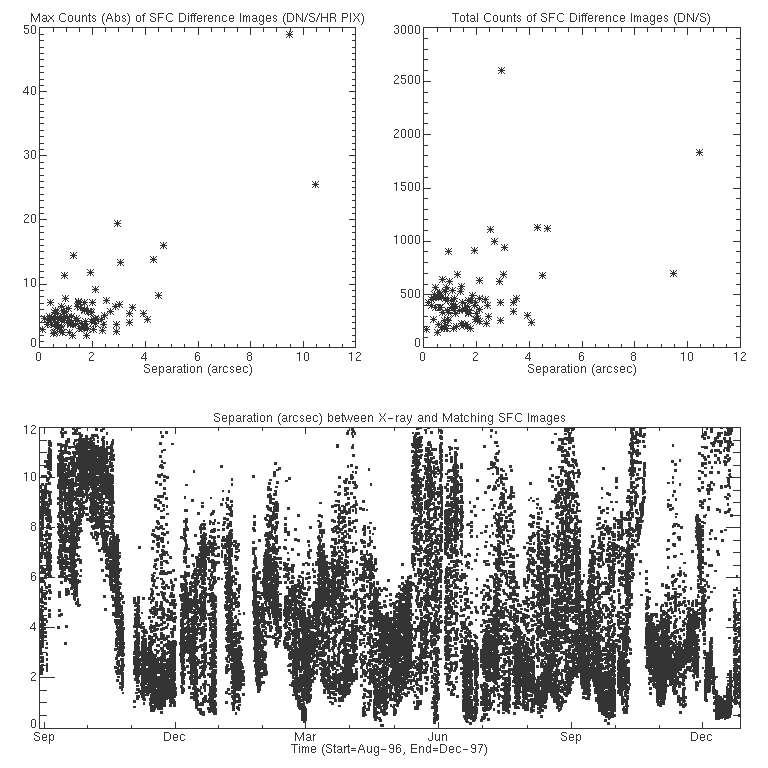
For straylight corrections of an SXT X-ray image after the entrance filter
opening, a leak image taken at a close pointing is subtracted, since we
expect it to have a similar straylight pattern to the X-ray image.  Therefore,
we expect two leak images taken at close positions to be quite similar,
resulting in their difference images having small signals and little spatial
variations.  But when I studied (in August 1997) the difference of two leak
images taken at close positions, I found that it was not necessarily the case.
The difference image showed the trace of the pinholes as well as the
``retina'' pattern (close to disk center but on the eastern hemisphere).

Here, using the new leak database (isass0data4/yohkoh/ydb/sfc_orb_correct)
stored at ISAS, and the newly added criterion of selecting the closest leak
image, I have done a similar exercise.  After Professor Acton (SXT-U PI),
the separation should be defined as sqrt( (x1-x2)^2+(y1-y2)^2+(r1-r2)^2).
The term (r1-r2)^2 in sqrt represents the difference of solar radius at
the times of two images.  Everything is expressed in arcsec.

The plot at top left shows the maximum value in the difference image with
the separation.  Most images show the maximum count of (2-7) DN/s/HR Pixel.
The one at top right shows the RMS signals from the entire difference image,
again plotted with the separation.  Most images are included in the range
of (200-600) DN/s.  These plots don't necessarily indicate that the
difference image becomes darker and flatter as the separation approaches 0.

The bottom plot shows separations of the X-ray images, taken at normal
pointing, in thin Al filters between late August 1996 and December 1997 from
their closest leak images.  There are more images with larger separations,
but here the plot shows only those with separation less than 12 arcsec.
The peak of the distribution of separation is between 2" and 3".


Nariaki Nitta,  20-Feb-98
