
|
Documentation > SXT Observation Notes > this page |
Image name: Jan_99_Ent_Filt_Evnt.png (click image to enlarge)
Image size: 135.683 KB (512x768)
Date submitted: 23-Feb-1999
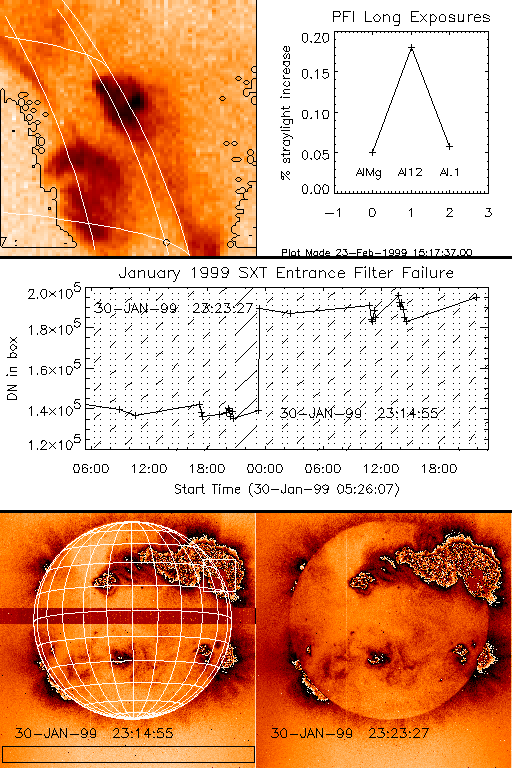
                  JANUARY 1999 SXT ENTRANCE FILTER FAILURE

This analysis demonstrates that the time of the January 1999 entrance
filter event is on or about

		30-JAN-99 23:17.

The figure shows 2 QR images, before and after the entrance filter
event.  The increased background signal is evident, even by visual
inspection of the unscaled images.  These images have been dark
subtracted but not leak corrected.

The light curve in the center of the figure is the total signal in the
black box shown in the lower left FFI.  Clearly, the entrance filter
event happened between the 2 QR exposures.  Nights are indicated by the
cross-hatched bars.  (The "long night" problem in the middle of the
plot has been noted and reported.)

The following set of PFIs were acquired at the time of the event.
Their location is indicated by the white square on the FFI in the lower
right.

 0 30-JAN-99  23:13:03  QT/M  Open /AlMg  Half Norm C  13    78.0 64x64
 1 30-JAN-99  23:14:07  QT/M  Open /Al12  Half Norm C  21  1338.0 64x64
 2 30-JAN-99  23:15:11  QT/M  Open /Al.1  Half Norm C  11    38.0 64x64
 3 30-JAN-99  23:16:15  QT/M  Open /AlMg  Half Norm C  11    38.0 64x64
 4 30-JAN-99  23:17:19  QT/M  Open /Al12  Half Norm C  19   668.0 64x64
 5 30-JAN-99  23:18:23  QT/M  Open /Al.1  Half Norm C   9    17.0 64x64
 6 30-JAN-99  23:19:27  QT/M  Open /AlMg  Half Norm C  13    78.0 64x64
 7 30-JAN-99  23:20:31  QT/M  Open /Al12  Half Norm C  21  1338.0 64x64
 8 30-JAN-99  23:21:35  QT/M  Open /Al.1  Half Norm C  11    38.0 64x64

I prepared a data cube with co-aligned dark (but not leak) subtracted
images from these PFI data.  The upper lefthand figure is a log scaled
example, image number 7.  The black contour outlines the faintest parts
of the PFIs.  The dark-corrected signal in this area has been summed
and used in the following analysis.

Comparison of the first 3 pfis with the last 3 pfis indicates that the
filter event happened between image 2 (23:15:11) and image 6
(23:19:27).  The upper righthand plot shows the percentage increase of
signal in the faint-signal area for each filter.  Al.1 and AlMg each
increased about 5% whereas Al12 increased 18%.  This is consistent with
previous experience that each filter passes stray visible light in its
own unique way.

Images 3-5 are taken with an exposure about half of the first and last
sets of three.  I have formed ratios of the exposure durations and
signals for each long/short pair of images and display them in the
following table.

Image numbers	 0/3	 1/4	 2/5	 6/3	 7/4	 8/5

Exposure ratio	2.04	2.02	2.21	2.02	2.03	2.24
Signal ratio	1.63	1.60	1.60	1.71	1.90	1.67

None of these ratios scale strictly with exposure.  This is evidence
for an uncorrected, exposure independent, background component of the
order of 1 DN per HR pixel.  If I assume that this is a constant for
all exposures, being independent of exposure and since all filters
using the same darkframes, then I can test the signal ratios when
corrected for this assumed constant background.  For a constant dark
background of 0.6 DN per HR pixel the revised signal ratios become:

Rev. sig ratio	2.01	1.70	1.92	2.14	2.03	2.03

This solution would indicate that the entrance filter failed between
PFI exposures 3 and 4 (23:16:15 - 23:17:19) because both the 0/3 and
7/4 signal ratios now agree with the exposure ratio.  I cannot explain
why the adjusted ratios for 2/5 and 8/5 do not agree with the exposure
ratios (which, BTW, are consistent with the shutter calibration).
There is no single constant background that can make the Al.1 ratios
consistent with the other 2 filters.

However, specifying the time of the filter event between PFIs 3 and 4,
i.e., 30-Jan-99 23:17, is sufficient for data analysis purposes.

					L. W. Acton
					23-Feb-99
