
|
Documentation > SXT Observation Notes > this page |
Image name: FMS_DARKSIGNAL_CHANGE.png (click image to enlarge)
Image size: 75.2170 KB (512x768)
Date submitted: 22-Oct-1996
LWA 22-Oct-96
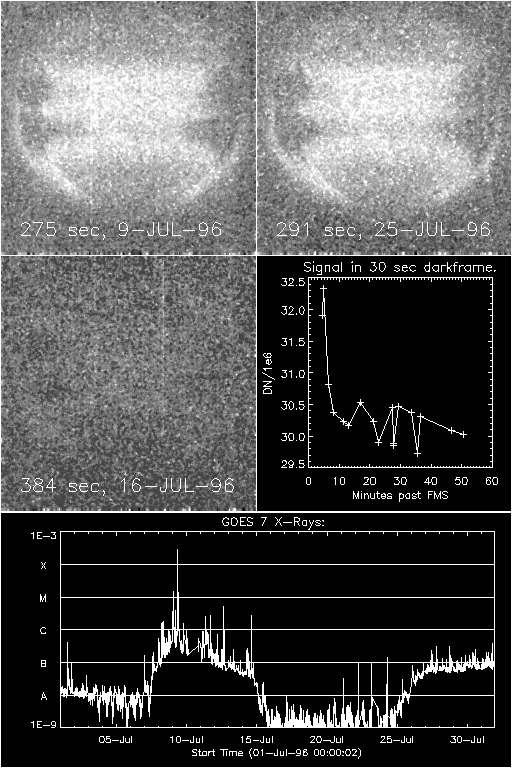
ORBIT VARIATION OF CCD DARK CURRENT
EFFECT OF UV FLOOD
I have, by accident, discovered the reason for the sharp decrease in CCD
dark signal just after FMS. Somehow, the UV flood causes a temporary
increase in dark signal in the moderately radiation damaged regions. This
increase quickly fades as illustrated in these three rebinned
median-filtered difference images. The original exposures were HR DPE=30
darkframes and I have taken the difference between the dark frame taken at
the times indicated after FMS and a dark frame taken 50 minutes after FMS.
The total signal in the 18 dark frames examined from July 1996 are shown in
the plot as a function of time past FMS. During July '96 the morning UV
flood interval was set to 2 minutes.
Note that by 6 minutes after FMS the excess dark current image has nearly
faded. This has been verified by examining the entire set of dark images
and some other examples. The effect does not seem to depend strongly on
solar activity as the 9-Jul-96 case was obtained during a period of
relatively intense activity while the 25-Jul-96 case was following a period
of very low activity. The late-orbit reference image was obtained on
30-Jul-96 but the effect seen here is the same for any reference image
taken after 7 minutes following FMS.
Just for the record, here are the data examined:
FMS order Image # Min since FMS Time of darkframe Total DN
0 6 4.5867500 9-JUL-96 03:15:19 3.19149e+07
1 11 4.8461333 25-JUL-96 09:40:19 3.23399e+07
2 7 6.3943333 16-JUL-96 10:14:37 3.08138e+07
3 5 8.2409333 3-JUL-96 01:29:58 3.03728e+07
4 3 11.274683 2-JUL-96 22:18:30 3.02280e+07
5 4 12.991117 2-JUL-96 23:57:28 3.01756e+07
6 12 16.962533 25-JUL-96 11:29:41 3.05390e+07
7 8 21.326900 16-JUL-96 15:21:03 3.02412e+07
8 2 22.710117 2-JUL-96 07:54:56 2.98950e+07
9 10 27.364883 24-JUL-96 19:28:05 3.04580e+07
10 0 27.593783 2-JUL-96 04:45:34 2.98828e+07
11 1 27.660333 2-JUL-96 06:22:38 2.98490e+07
12 13 29.314133 29-JUL-96 17:49:02 3.04713e+07
13 14 33.597217 29-JUL-96 19:30:34 3.03813e+07
14 9 35.609383 16-JUL-96 20:27:05 2.97284e+07
15 16 36.612950 30-JUL-96 02:02:50 3.03172e+07
16 17 46.578433 30-JUL-96 10:19:18 3.00906e+07
17 15 50.629833 30-JUL-96 00:39:36 3.00347e+07
and here is the program I used to examine the difference images:
for i=0,5 do begin
img=big_smooth(dout_fnl(*,*,ii(i))-dout_fnl(*,*,15),/medsmooth,5)
wset,0
tvscl,img>(-15)<15
wset,1
plot_hist,img,/log
pause
endfor
end
