
|
Documentation > SXT Observation Notes > this page |
Image name: DP_rate_and_Dec_96_glitch.png (click image to enlarge)
Image size: 7.33500 KB (640x512)
Date submitted: 18-Dec-1996
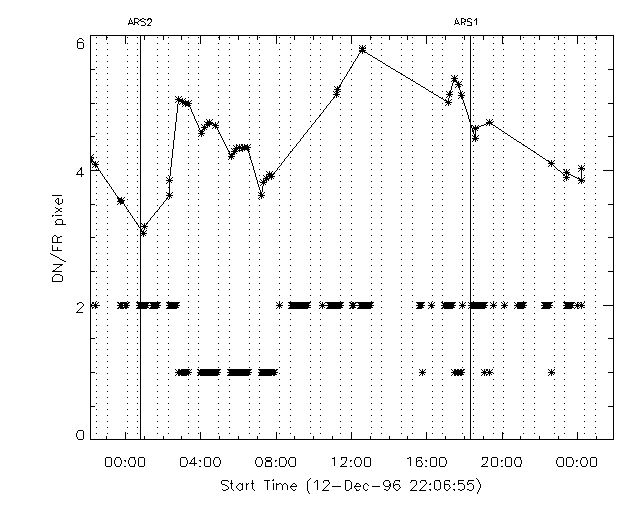
Time plot showing the streak brightness (upper points) compared with
the DP rate (lower points; high rate = 2 and medium rate = 1). The
vertical lines show table uploads. The ARS2 table was set on a different
location from that of the problem pixels; ARS1 put the PFI's on those
pixels and reduced the exposure times in AEC by a factor of 2 or so.
We think the exposure fraction was about 15% during high rate, and about
2% during medium rate, during the ARS2 observations.

What do we see? The lower exposure fraction of the medium-rate table
between 02:00 and 08:00 apparently allowed the streak to diminish
somewhat; the high rate later on caused a net gain over and above
the smaller fluctuations due to orbit day/night intervals that can be seen
during the medium-rate observations. However later on the active
region may have gotten dimmer, compensating for the increased exposure.
We haven't done this analysis yet.

MW, HSH  18-Dec-96
