
|
Documentation > SXT Observation Notes > this page |
Image name: DARKFRAME_STATISTICS.png (click image to enlarge)
Image size: 152.096 KB (1024x986)
Date submitted: 15-Nov-1997
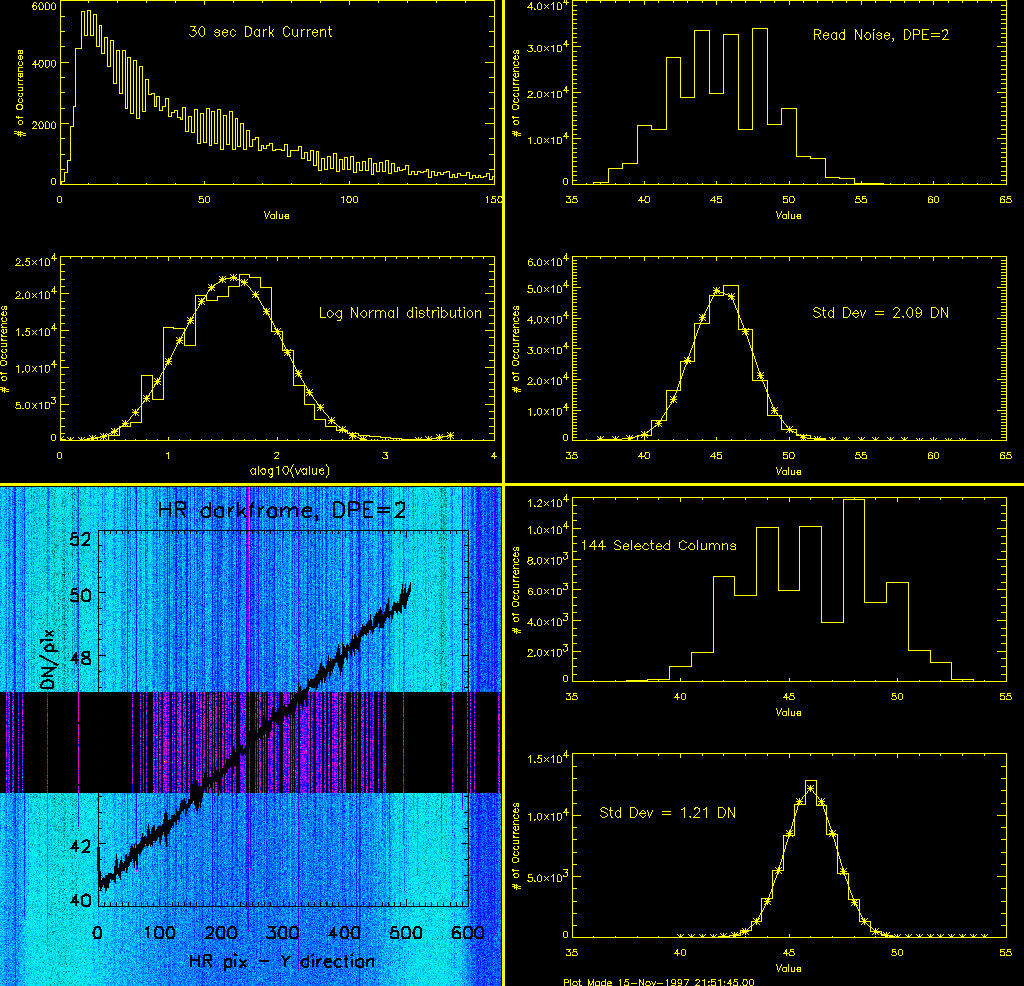
		STATISTICAL PROPERTIES OF SXT DARKFRAMES

The uncertainties produced by sxt_prep are only the decompression errors.
The program sxt_dn_unc only provides an estimate of the counting statistics
in the fully-corrected x-ray image.  We have no software that provides an
estimate of the error introduced by darkframe statistics nor the effect of
straylight subtraction.

As a start on understanding some of these sources of uncertainty we have been
ignoring I've taken a look at the half-resolution dark frames from 24-JUL-96.
The read noise is from the DPE=2 darkframe and the dark current is from the
difference of the DPE=30 and DPE=2 darkframes.  For the dark current (upper
LH panel) I find that the statistics of the dark current are highly
non-Poissonian.  In fact, as illustrated in the lower plot of the panel, the
dark current statistics are fairly close to a log-normal distribution.  This
is evidenced by the reasonable fit of a Gaussian to the histogram of the
logarithm of the dark current signals from this dark image.  I haven't a clue
as to how to formally treat this source of error in SXT analysis.

The read noise statistics are somewhat more tractable.  The figure in the
lower left illustrates the DPE=2 darkframe with the average slope
(illustrated in the overlaid plot) removed.  The histogram of the
_unflattened_ darkframe is shown in the uppermost RH plot.  In the next plot
down I show the histogram of _flattened_ (i.e, readout slope removed)
darkframe with the average value added back in.  This distribution is quite
well fit by a Gaussian.  The standard deviation is quite small, indicating
that the read noise approximates a DC pedestal with only a small statistical
component.

In the 2 lower RH plots I concentrate on 144 columns which have nearly the
same total read noise signal.  These columns are identified in the middle
section of the darkframe image.  This selection further narrows the
distribution as shown in the plots.  As the darkframe subtraction is done
column by column, i.e., with pixel match between the x-ray picture and the
darkframe, this narrower distribution is appropriate for use as the
statistical error coming from the read noise.

I am still puzzling over how to propagate the straylight error.  The SFCs are
highly smoothed in order to minimize any contribution to the statistical
error of the corrected x-ray image.  However, it is clear that straylight
subtraction is far from perfect.  Somehow we need to figure a way to estimate
this uncertainty if the error bars placed on SXT temperatures and emission
measures are to be valid.

					L. Acton
					15-Nov-97
