ATT Status for Jan 1 - March 5, 1998
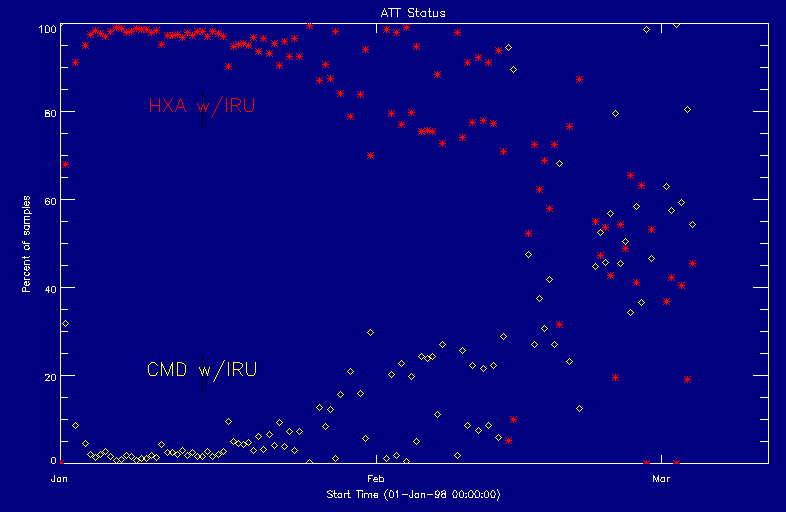
Image name: ATT_status_1998_before.png (click image to enlarge)
Image size: 6.233 KB (786x512)
Caption : Before update of the HXA database.
Date submitted: 04-Mar-1998
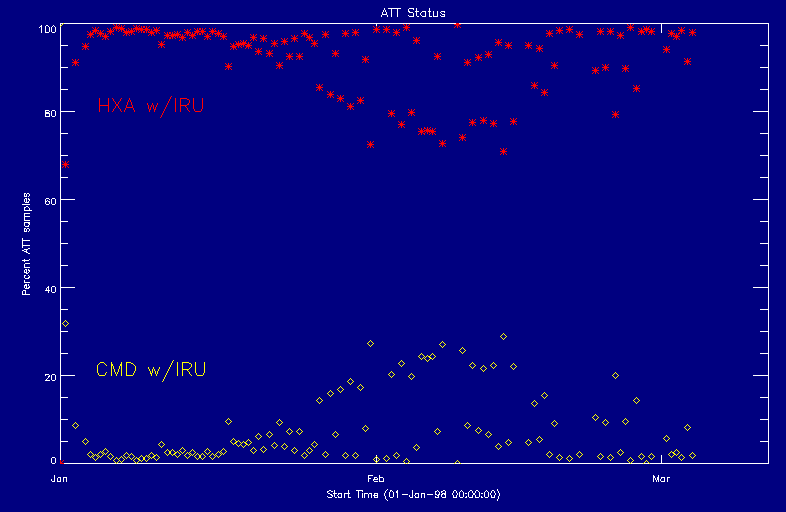
Image name: ATT_status_1998_after.png (click image to enlarge)
Image size: 5.641 KB (786x512)
Caption : After update of the HXA database.
Date submitted: 05-Mar-1998
Description:
Yohkoh ATT Status for Jan 1 - March 5, 1998
Due to a backlog in Yohkoh final reformatting, the database which reflects
the apparent solar diameter as seen by HXA was out of date starting
around Jan 25, 1998. Due to drift in HXA outputs coupled with HXA gain
changes in mid February, this started causing an increase in the number
of Yohkoh Attitude records flagged as bad. For those bad points, the ATT
entry was derived from an IRU correction to the Yohkoh
commanded instead of the prefered use of the IRU corrected
HXA values. One of the symtoms noticed first was
an apparent misalignment between the 2 images in the SFD composite pairs
which is now attributed component images which mapped into ATT records
using the two different sun center derivation methods (commanded and
HXA)
What the plots indicate
For the period 1-Jan-1998 through 5-March-1998, the percentage of ATT records
with a given derivation method are plotted. The red points indicate ATT
records which used HXA/IRU (good) and the yellow points indicate
ATT records which used CMD/IRU (bad). As expected, after updating
the HXA solar diameter data base, the number of HXA derived ATT records
is much higher. Data after Jan 25 reflects KSC data only due to the
backlog in final reformatting. The residual trends in the data
are interesting and not yet understood. We can repeat this plot after
final reformatting has progressed.
Jean-Pierre Wuelser and Sam Freeland