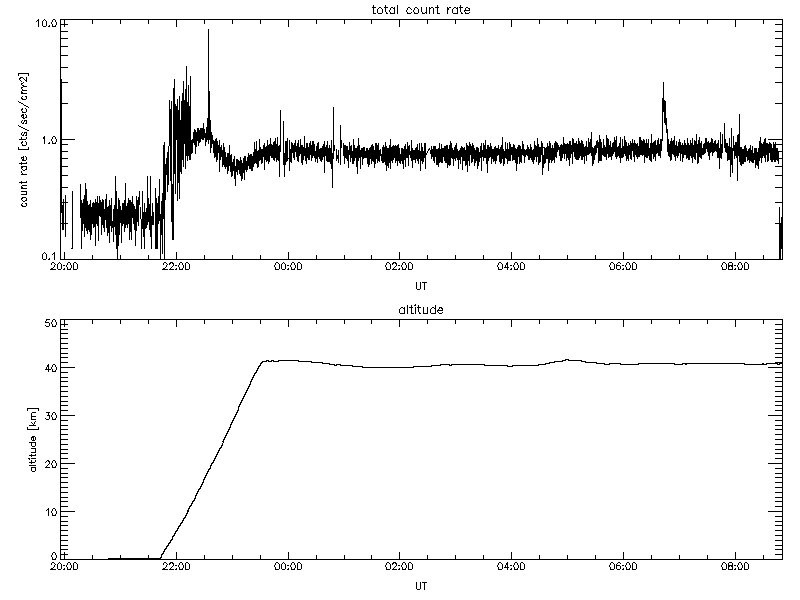
The bottom curve shows the balloon altitude vs. time.
A balloon, a novel detector, and solar
hard X-rays
|
The time history of the balloon flight on May 24, 2002, which intercepted
an M-class solar flare.
This covers the entire interval from launch to "cutdown".
Interesting things to notice are the broad peak in counting rate at
about 22:00-22:30 UT, which would be the "Pfotzer maximum"
resulting from the interactions of galactic cosmic rays in the Earth's
atmosphere, and (!!) the sharper peak at about 06:40 JST - a solar
flare!
The bottom curve shows the balloon altitude vs. time. |
|
The detectors carried by the balloon are a novel type, CdTe solid-state detectors with good spectral resolution and room-temperature operation. These detectors look very attractive for future imaging applications because they can be segmented (pixelized). The balloon payload contained 16 CdTe detectors, each 10x10x0.5 mm, with energy resolution some 3 keV over the range 15-120 keV. Lower energies, of course, are absorbed by the residual atmosphere at balloon altitudes. In this process, incidentally, they create the ionosphere's D-region.
Note that in the following we are describing quite preliminary views of the remarkable data obtained from the balloon. This will be the basis for Ken Kobayashi's PhD thesis for the University of Tokyo.
The plot below shows the usual timing reference for flare effects, the GOES soft X-ray time history:
| The GOES time history (soft X-rays) for the event observed by the balloon. Note that this plot is in UT, which is more universal.o It shows both GOES channels, nominally at 1.5 and 3 keV, just the energies of photons absorbed by the atmosphere above the balloon. This absence of the intense thermal soft X-radiation makes it possible for a large-area balloon-borne detector not to saturate during a major solar flare. Note that the time scale is greatly expanded here, and that the spike observed in hard X-rays matches the major rise in soft X-rays - the "Neupert Effect." |
|
Now let's look in more detail and compare the balloon observations with those from RHESSI.
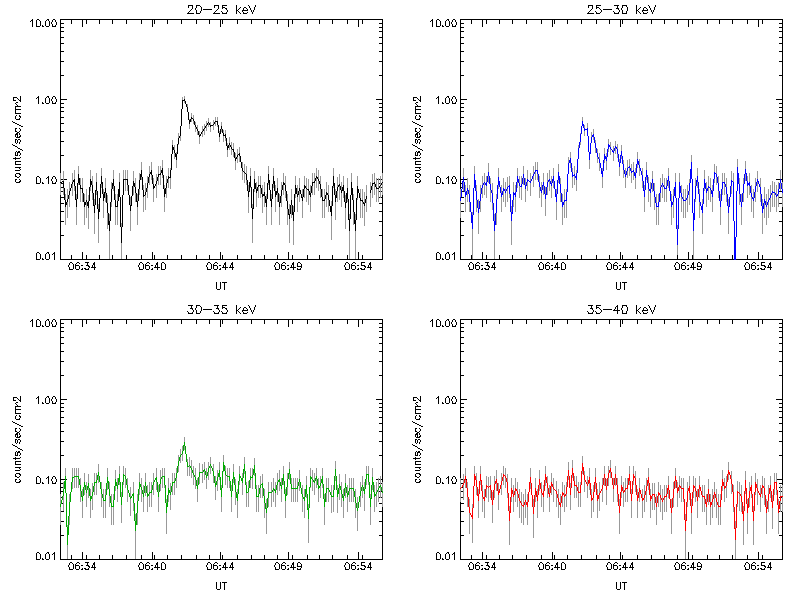
The RHESSI data turn out to have missed much of the event because of Earth occultation, but some useful data were obtained. The plots below show the spectrally-resolved time histories from the balloon and from RHESSI:
|
Lightcurves in broad energy bands from the balloon-borne detectors. Note the two major intervals of hard X-ray emission - an impulsive first part, and a more gradual second part. This seems to have a markedly softer hard X-ray spectrum. |
| The RHESSI light curves, in the four broad bands familiar from the HXT instrument on Yohkoh. RHESSI unfortunately missed the gradual part of the event, which could turn out to be quite interesting, but it did see weak earlier events not detected by the balloon. This is probably because of the absence of atmospheric absorption for the spacecraft, so that 13 keV comes through unattenuated. |
|
This was just a snapshot of the data from the balloon. It has proven the virtues of the CdTe detector type, for which this is the first solar application that we are aware of. We would dearly like to see a large-area version of this instrument in an imaging instrument, preferably with sub-arcsecond resolution. We look forward to the full analysis of these data.
June 28, 2002
Hugh Hudson (hudson@lmsal.com) with thanks to Ken Kobayashi, Saku Tsuneta, and their balloon team.