 |
 |
 |
Science Nugget: Jun 18, 1999
Introduction
Yohkoh recently observed a beautiful arcade in the aftermath of the eruption of a giant polar crown filament. Polar crown filaments are usually very large in extent, of the order of 200,000 km or more in length, and are long-lived, often up to months. Since there are so few of them, and they live so long, their eruptions (marking the end of their lifes) are rare compared to eruptions of active region filaments.
Strong X-ray emission from loops formed through reconnection in the wake of an erupting polar crown filament is also a rarity. The reason is that the Solar magnetic field near the poles is relatively weak, about 10 Gauss or less, compared to 100 to several 100 Gauss in active regions at mid-latitudes. The energy in the field scales as the square of the magnetic field strength, so active regions have typically at least 2 orders of magnitude more energy per unit volume as regions near the polar crown. A fraction of that energy, say 10%, is released during the filament eruption and the ensuing flare, and a part of that energy is emitted in Soft X-rays observed by SXT, by plasma in an arcade of postflare loops that has been heated to temperatures between 3 and 30 million Kelvin. So one can expect the X-ray emission in a crown arcade to be about 100 times less intense than in an active region.
|
|
|
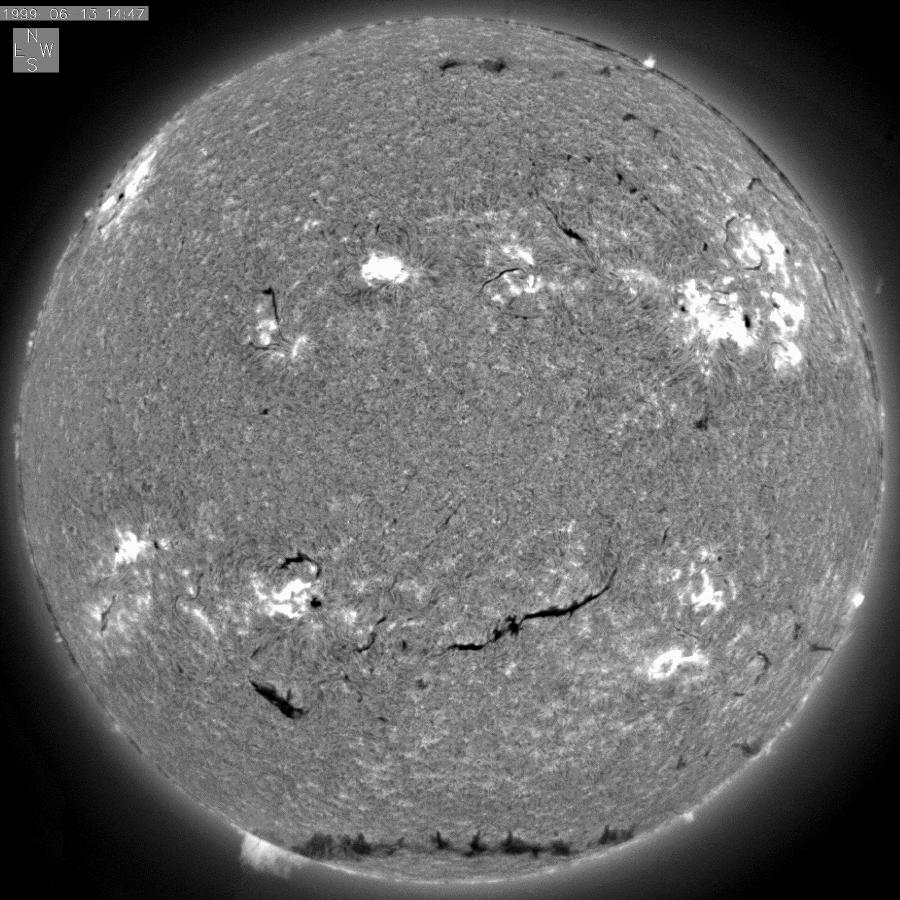
In just a few hours pretty much the whole filament has disappeared! Did it really erupt? Well, look at an image, below left, taken by the EIT telescope onboard the SOHO spacecraft, taken in the light of Helium II at 304 Angstrom on 14 June 1999 at 13:19 UT, nearly simultaneous with the Meudon image. The whole eastern part of the structure appears to be ripping into space, while the western part is still firmly on the Sun, as the Meudon image also shows. And that's not all! Look at what the LASCO C2 coronograph saw two hours after the EIT image (second image from the left below), on 14 June 1999 at 15:06 UT. The Solar disk is indicated by the white circle in the middle of the C2 occulting disk, which itself blocks out the light directly from the Sun up to 2 Solar radii above the limb -- so that it can better see the faint reflections from material higher up.
 |
 |
 |
 |
The filament, or at least the lasso-like magnetic structure coming from that same region, has already reached a distance of 6 Solar radii above the surface, just over 4 million km. If it has been travelling at a velocity of about 500 km/sec, which is typical for these types of eruptions, it must have taken off about 2 hours and 20 minutes before the time of this image, around 12:45 UT. That would not be inconsistent with the EIT image above, which shows the eruption in its early stages at 13:09 UT. We will be able to determine the velocity and the onset of the eruption more precisely by studying all the images from these instruments for that timeframe. Finally, the two images on the right hand side are from the LASCO C3 coronograph, which has a larger field of view than C2; the radius of the occulting disk is 3.7 Solar radii. The first image of the two was taken on 14 June 1999 at 16:18 UT, and shows clearly the Coronal Mass Ejection (CME) that is linked with the filament eruption. Unfortunately a small part of the image is obscured by the C3 support pylon, that holds the occulting disk in place. Just to prove that this CME is indeed connected to the eruptive event observed in H-alpha and by EIT, I put an earlier LASCO C3 image right next to it, on the extreme right hand side. That image was taken on 14 June 1999 at 12:42 UT, and there is no sign of a CME whatsoever yet. Note how the background stars are clearly visible, that is how well the occulting disk suppresses the direct sunlight.
 |
 |
 |
 |
The first picture, taken at about an hour after the Meudon H-alpha image above, shows a cusped loop stretching out after the erupted filament in that image. In the second X-ray picture, at about the time of the LASCO C2 image, a whole arcade of loops has emerged. Note that the brightness of this arcade, although it represents a flare event, is quite a bit less than that of the quiet active regions along the equator. The reason is the low strength of the magnetic field near the poles, as was explained in the introduction. While the filament eruption and CME continue the arcade slowly grows larger and higher in the third and fourth SXT image. An interesting feature, best seen in the full-size images, is the magnetic loop linking the arcade with a small active region near the Solar equator.
June 21, 1999: Piet Martens
(martens@isass0.solar.isas.ac.jp)