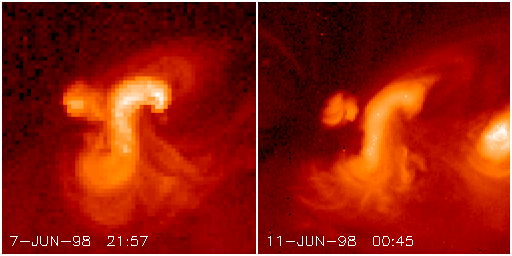
The above images (10 arc min square) show a view of the active region about one day before the events of interest (on the left) and a view two + days later (right). The new thing we may have learned here is that any restructuring involved in the CME formation can repair itself fairly quickly. The "sigmoidicity" may have changed, but we don't really have any quantitative way yet to interpret the degree to which a solar structure looks S-shaped. The images shown here have been registered (solar rotation correction, but no allowance made for 3D perspective effects).
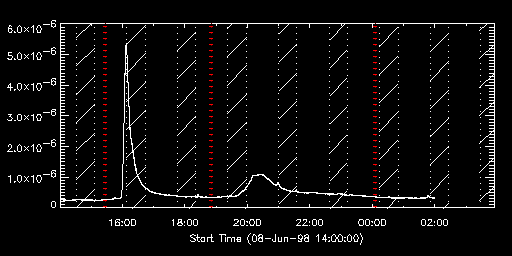
We have taken individual SXT images from the three times shown with colored lines on the light curve below (before the flare, after the flare, and after the slow GOES event; the hatched regions show Yohkoh orbit night).
Now, the figure below shows the images and the difference images:
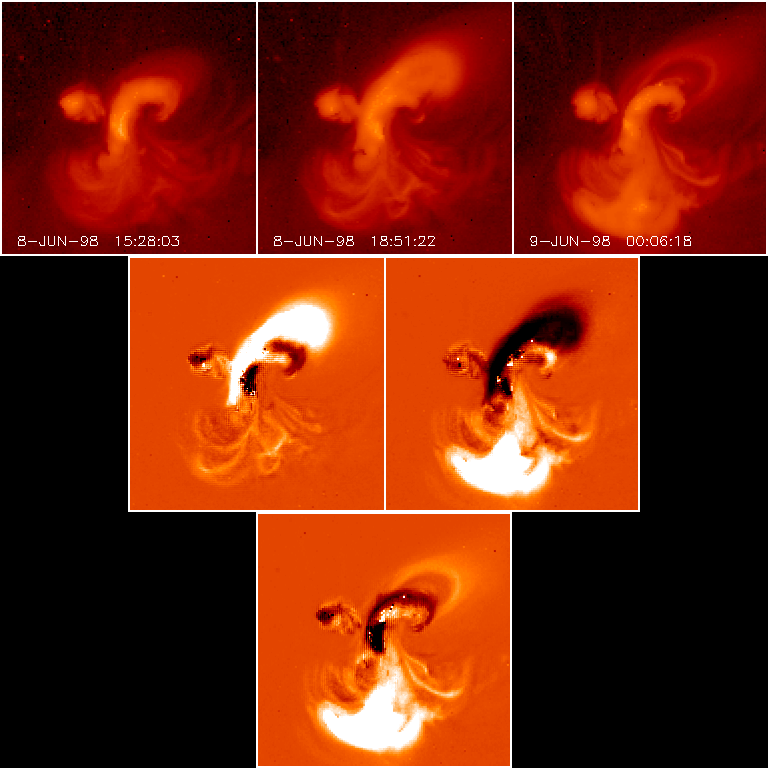
Top row, the real data; middle row, the running differences; bottom row, a full difference. That is, top line shows images 1, 2, and 3; the middle line shows 2 minus 1 and 3 minus 2, and the bottom image is 3 minus 1. Dark represents a deficit and bright represents an excess in each case. Running differences are tricky and often cause headaches, but normalizing them this way seems to show the following: the flare served to inflate the sigmoid, and the slow GOES event that followed the flare represented the formation of the post-flare loop system (the bright structure in the S). The disappearance of the sigmoid left its negative representation in the full difference image (bottom) - can this be interpreted as "transient coronal holes" following a flux-rope ejection, or is there something more complicated here?
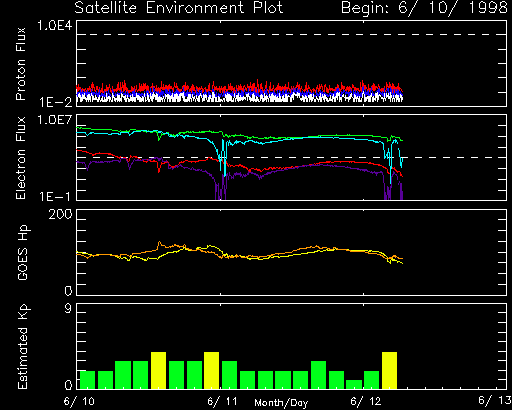
Now, the bottom line: The plot below, copied from NOAA's "Today's Space Weather" page, shows an increase in Kp (the yellow entry at the far right) at the time predicted by Brueckner's law, pi days from Sun to Earth (within about 8% in this case):
Eureka! But this is just one example of the strong result on halo CME effects pointed out by Chris St. Cyr at the SPD/AGU meeting last month.