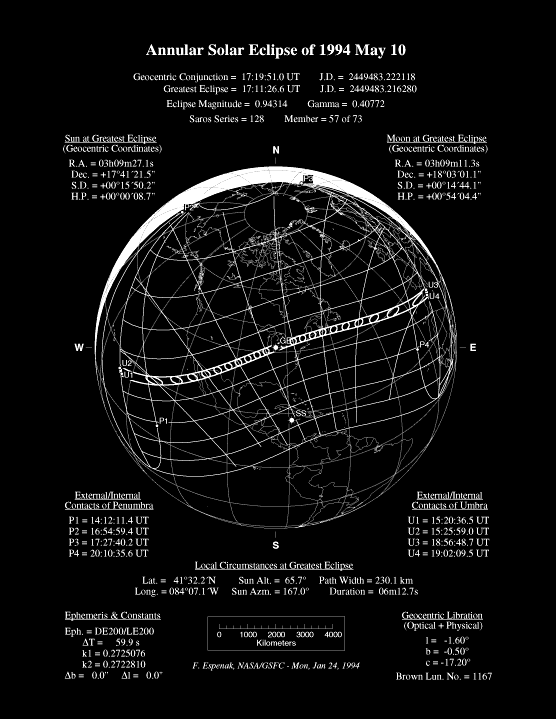
Figure 1 is an orthographic projection map of Earth [adapted from Espenak, 1987] showing the path of penumbral (partial) and umbral (annular) eclipse. The daylight terminator is plotted for the instant of greatest eclipse with north towards the top. The sub-Earth point is centered over the point of greatest eclipse and is marked by a '*' or asterisk. Earth's sub-solar point at that instant is indicated by a 'A' or star shaped character.
The limits of the Moon's penumbral shadow delineate the region of visibility of the partial solar eclipse. This irregular or saddle shaped region often covers more than half of the daylight hemisphere of Earth and consists of several distinct zones or limits. At the northern and/or southern boundaries lie the limits of the penumbra's path. Partial eclipses have only one of these limits, as do central eclipses when the shadow axis falls no closer than about 0.45 radii from Earth's center. Great loops at the western and eastern extremes of the penumbra's path identify the areas where the eclipse begins/ends at sunrise and sunset, respectively. If the penumbra has both a northern and southern limit, the rising and setting curves form two separate, closed loops. Otherwise, the curves are connected in a distorted figure eight. Bisecting the 'eclipse begins/ends at sunrise and sunset' loops is the curve of maximum eclipse at sunrise (western loop) and sunset (eastern loop). The points P1 and P4 mark the coordinates where the penumbral shadow first contacts (partial eclipse begins) and last contacts (partial eclipse ends) Earth's surface. If the penumbral path has both a northern and southern limit (as does the May 1994 eclipse), then points P2 and P3 are also plotted. These correspond to the coordinates where the penumbral shadow cone becomes internally tangent to Earth's disk.
A curve of maximum eclipse is the locus of all points where the eclipse is at maximum at a given time. Curves of maximum eclipse are plotted at each half hour Universal Time. They generally run from the northern to the southern penumbral limits, or from the maximum eclipse at sunrise and sunset curves to one of the limits. The curves of maximum eclipse run through the half-hourly outlines of the umbral shadow, from which the Universal Time of each curve can be identified. The curves of constant eclipse magnitude[2] delineate the locus of all points where the magnitude at maximum eclipse is constant. These curves run exclusively between the curves of maximum eclipse at sunrise and sunset. Furthermore, they're parallel to the northern/southern penumbral limits and the umbral paths of central eclipses. The northern and southern limits of the penumbra may be thought of as curves of constant magnitude of 0.0. The adjacent curves are for magnitudes of 0.2, 0.4, 0.6 and 0.8. For total eclipses, the northern and southern limits of the umbra are curves of constant magnitude of 1.0. Umbral path limits for annular eclipses are curves of maximum eclipse magnitude. The magnitude is always less than 1.0 for annular eclipses.
In the upper left corner of Figure 1 are the Universal Times of greatest eclipse and conjunction of the Moon and Sun in right ascension, followed by the minimum distance of the Moon's shadow axis from Earth's center in Earth radii GAMMA and the geocentric ratio of diameters of the Moon and the Sun RATIO. To the upper right are exterior contact times of the Moon's shadow with Earth. P1 and P4 are the first and last contacts of the penumbra; they mark the start and end of the partial eclipse. U1 and U4 are the first and last contacts of the umbra; they denote the start and end of the annular eclipse. Below the map are the geocentric coordinates of the Sun and Moon at the instant of greatest eclipse. They include of the right ascension RA, declination DEC, apparent semi-diameter SD and equatorial horizontal parallax HP. The Saros series for the eclipse is listed, followed by a pair of numbers in parentheses. The first number identifies the sequence order of the eclipse in the Saros, while the second is the total number of eclipses in the series. The Julian Date JD at greatest eclipse is given, followed by the extrapolated value of Delta_T[3] used in the calculations. Finally, the geodetic coordinates of the point of greatest eclipse are given, as well as the local circumstances there. In particular, the Sun's altitude ALT and azimuth AZ are listed along with the duration of umbral eclipse (minutes:seconds) and the width of the path (kilometers).
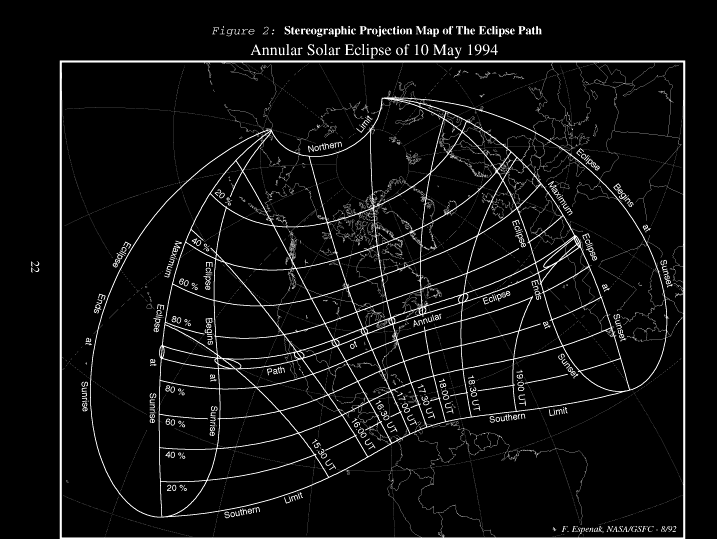
The stereographic projection of Earth in Figure 2 depicts the path of penumbral and umbral eclipse in greater detail. The map is oriented with the point of greatest eclipse near the center and north is towards the top. International political borders are shown and circles of latitude and longitude at plotted at 20deg. increments. The saddle shaped region of penumbral or partial eclipse includes labels identifying the northern and southern limits, curves of eclipse begins or ends at sunrise, curves of eclipse begins or ends at sunset, and curves of maximum eclipse at sunrise and sunset. Curves of constant eclipse magnitude are plotted for 20%, 40%, 60% and 80%, as are the limits of the annular path. Also included are curves of greatest eclipse for every thirty minutes Universal Time.
Figure 2 may be used to quickly determine the approximate time and magnitude of greatest eclipse for any location from which the eclipse is visible.
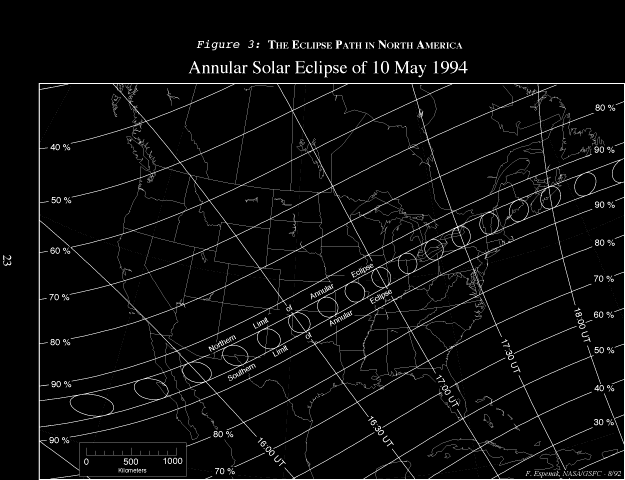
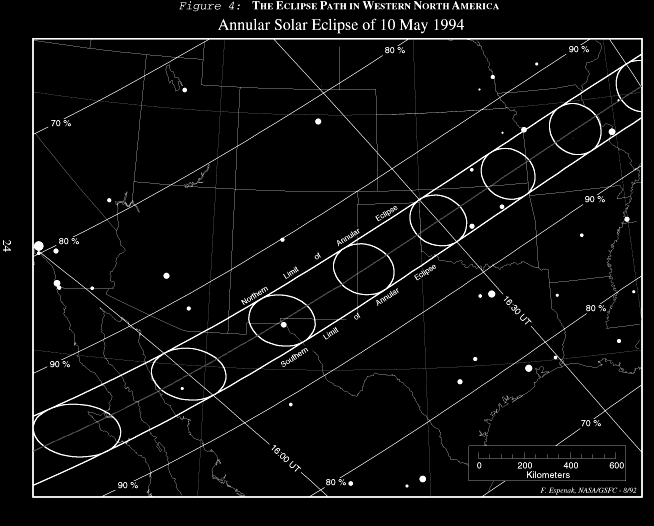
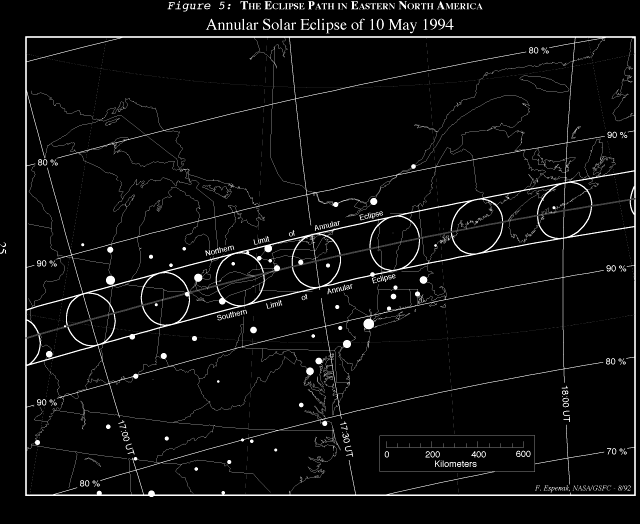
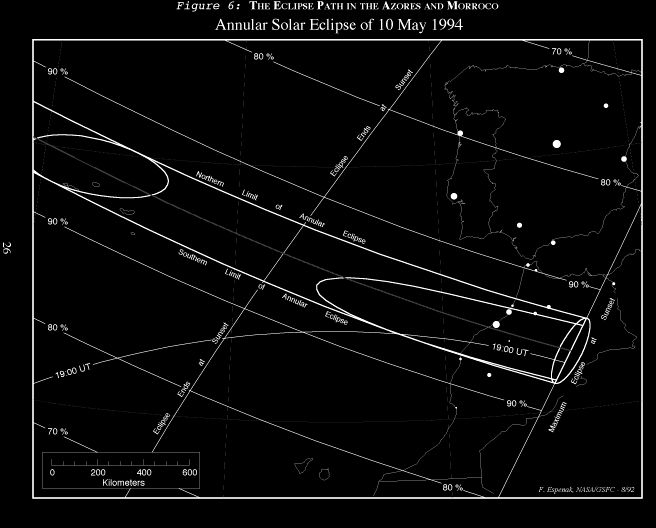
Figures 3, 4, 5, and 6 are equidistant conic projection maps which isolate specific regions of the eclipse path. The projection was selected to minimize distortion over the regions depicted. Once again, curves of maximum eclipse and constant eclipse magnitude are plotted along with identifying labels. A linear scale is included for estimating approximate distances (kilometers) in each figure. Within the northern and southern limits of the annular path, the outline of the umbral shadow is plotted at ten minute intervals. Figures 4, 5, and 6 are drawn at the same scale (~1:12,270,000) and include the center line as well as the positions of many of the larger cities or metropolitan areas in and near the central path. The size of each city is logarithmically proportional to its population.